Connect the dots with the dash
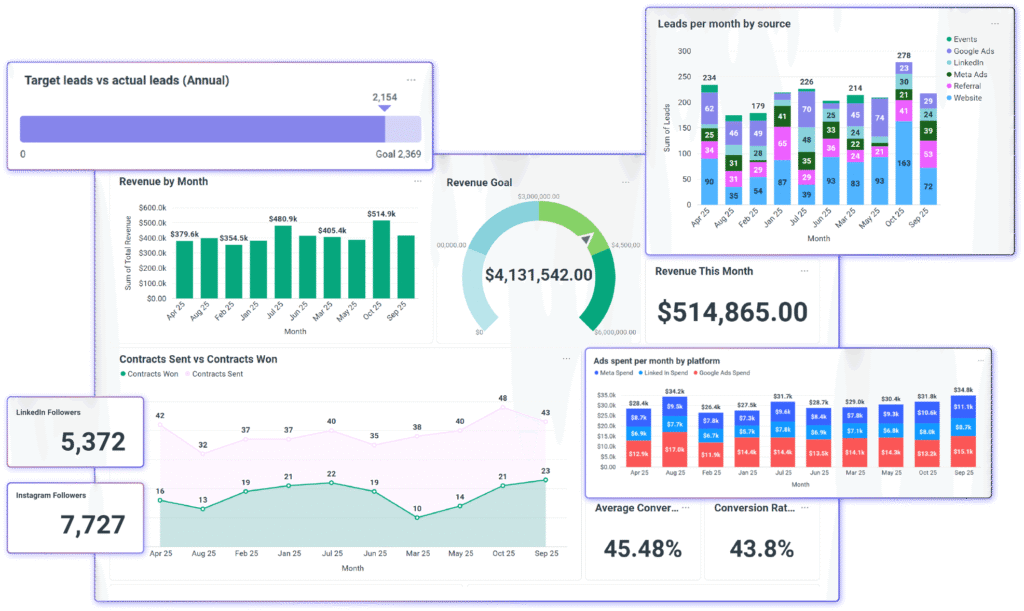
The dash pulls all your business data into crystal-clear dashboards that is custom built for you.
Instantly see how everything connects, spot opportunities and areas for improvement, and take action with knowledge and confidence.
Your Data, Decoded
Here’s how we identify the real problems in your business and turn them into growth opportunities.
01
Map Your Business
We start by truly understanding your business: your goals, your team, and the tools you rely on. No two businesses are the same, so we take the time to learn how you operate and what matters most to you.
02
Connect Your Tools
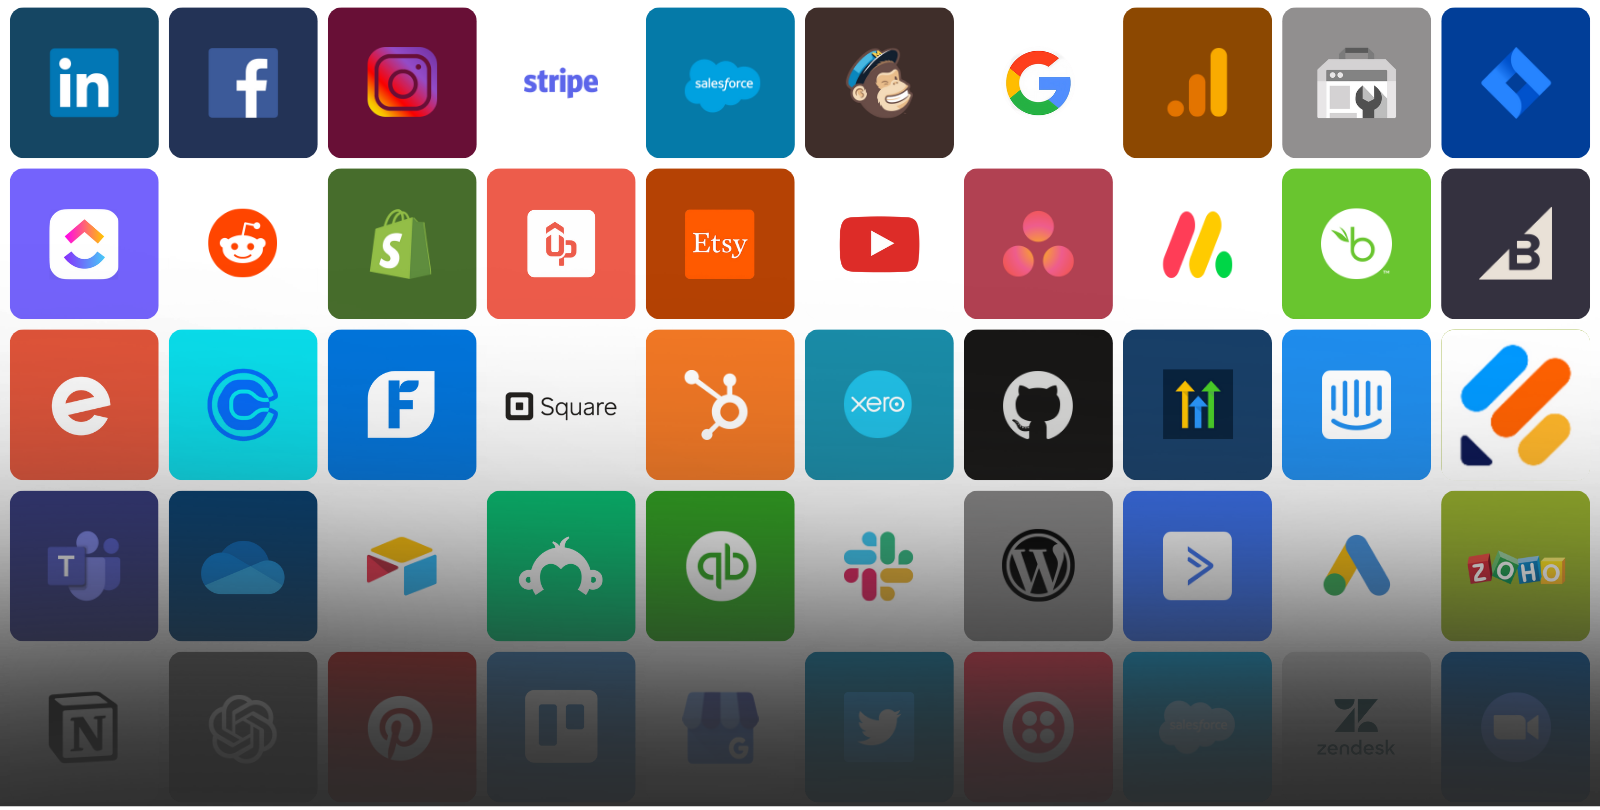
The dash integrates ALL your tools into a unified dashboard. From CRM and accounting software to project management solutions, marketing tools, ticketing systems and more, our team does the technical work so you can focus on the work-work.
03
Design Your Dashboards
The dash goes further than simply connecting your existing data. We help uncover what’s missing to reveal the metrics and insights you may not even be tracking yet, because the most valuable breakthroughs often come from the gaps you didn’t know existed. Armed with this information, we build powerful, easy-to-understand dashboards designed specifically for your business.
04
Get High-impact AI Insights
The dash AI doesn’t just analyze your data, it anticipates what’s next. By connecting signals and stats across your business, Dash uncovers patterns, predicts risks, and highlights opportunities to provide clear, prioritized recommendations on what actions to take next. No more drowning in data you can't interpret. Just straightforward insights that help you make smarter decisions, faster.
All Your Tools, Finally in One Place
No matter what tools you use (or how many!), we take care of connecting them all. Dash handles the setup, the connections, and the details, so everything just works.
Metrics That Matter
Every company (and every industry) defines success differently. The real challenge isn’t collecting data; it’s deciding which data actually matters, and organizing it in a way that makes sense.
That’s where Dash comes in. Our experts collaborate directly with your team to build dashboards that align data with direction and visualize not just where you are, but where you want to go.
Because data shouldn’t just inform. It should inspire.
Choose your industry to see the metrics that truly make an impact:
Key metrics:
Finance & Banking
Dashboards: Portfolio performance, compliance tracking, fraud detection, and profitability analysis.
- ROI, revenue growth, cost-to-income ratio
- Loan default rates
- Net interest margin
- Risk exposure
Key metrics:
Retail & E-Commerce
- Conversion rate
- Average order value (AOV)
- Customer lifetime value (CLV)
- Cart abandonment rate
- Inventory turnover
Key metrics:
Manufacturing & Supply Chain
- Production efficiency
- Downtime and utilization rates
- Supply chain lead times
- Quality defect rates
- On-time delivery percentage
Key metrics:
Technology & SaaS
Dashboards: Subscription growth, feature adoption, customer health, and ARR forecasts.
- Monthly recurring revenue (MRR)
- Churn rate
- Customer acquisition cost (CAC)
- Net dollar retention (NDR)
- Product usage analytics
Key metrics:
Education
Dashboards: Academic performance, resource allocation, and institutional growth tracking.
- Student enrollment and retention
- Graduation rate
- Student performance metrics
- Faculty workload
- Funding and grants utilization
Key metrics:
Construction
Dashboards: Project tracking, financial performance, and site safety compliance.
- Project completion rate
- Cost variance
- Safety incidents
- Equipment utilization
Key metrics:
Logistics & Transportation
Lorem ipsum dolor sit amet, consectetur adipiscing elit. Ut elit tellus, luctus nec ullamcorper mattis, pulvinar dapibus leo.
- On-time delivery rate
- Cost per mile
- Fleet utilization
- Fuel efficiency
- Incident frequency
Key metrics:
Real Estate
Lorem ipsum dolor sit amet, consectetur adipiscing elit. Ut elit tellus, luctus nec ullamcorper mattis, pulvinar dapibus leo.
- Pipeline
- Loan default rates
- Net interest margin
- Risk exposure
Key metrics:
Marketing
Dashboards: Campaign performance, multi-channel attribution, and ROI tracking.
- Click-through rate (CTR)
- Cost per lead (CPL)
- Customer conversion rate
- Campaign ROI
- Engagement metrics (reach, impressions)
Key metrics:
Coaching
Lorem ipsum dolor sit amet, consectetur adipiscing elit. Ut elit tellus, luctus nec ullamcorper mattis, pulvinar dapibus leo.
- Client progress toward goals
- Session attendance and completion rates
- Client satisfaction / NPS (Net Promoter Score)
- Retention and renewal rates
- Revenue per client or program
- Engagement with learning materials or tools